Waymo Open Dataset
The most successful ML projects in production (Tesla, iPhone, Amazon drones, Zipline) are where you own the entire stack. They iterate not just ML algorithms but also: 1) how to collect/label data, 2) infrastructure, 3) hardware ML models run on.
The above is the takeaway, summarized by Chip Huyen, from a CVPR 2021 talk by Andrej Karpathy, the Director of AI at Tesla. Not surprisingly, Tesla, among other big plyers like Waymo and Cruise, is one of companies that stands out from its competition.
Waymo, another big player, has released its dataset since 2019. The dataset is in TFRecord format, which requires TensorFlow for reading. This makes the tools and data preprocessing pipeline heavily depend on TensorFlow. If we look at KITTI, Lyft, TRI, or Argoverse, all of these release their dataset in a raw, simple format. As someone who used PyTorch more than TensorFlow back in those days, it was a pain inspecting and debugging the tf.data stuff, when eager execution was not available inside tf.data.
Looking at this a year later, and especially having listened to Andrej Karpathy’s CVPR 2021 talk, I start to appreciate and I could probably see why Google’s Waymo has released their dataset in TFRecord format. (Ironically though, if I remember correctly, the winner of the Challenge used PyTorch.)
The good news is… we can now use:
# TensorFlow 2.5
tf.data.experimental.enable_debug_mode()
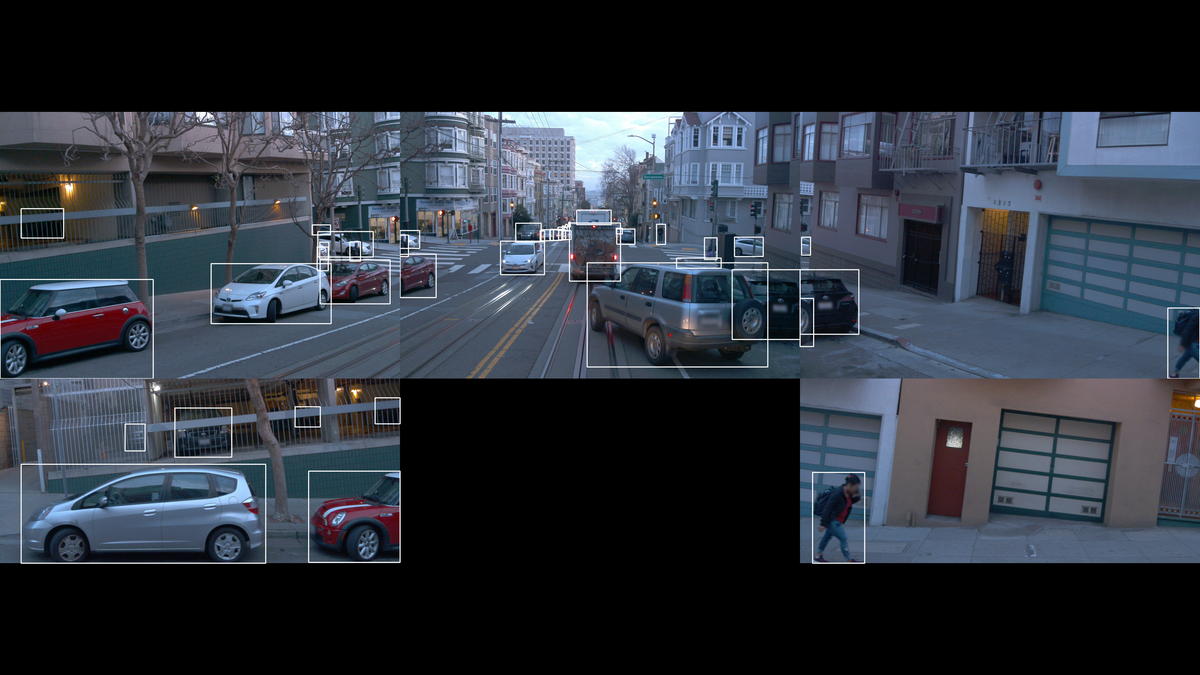
Enough for the introduction, let’s visualize the data.
Visualizing Camera Data
Most of the code is straightforward.
import tensorflow as tf
import matplotlib.pyplot as plt
import matplotlib.patches as patches


# Replace FILENAME with tfrecord file
dataset = tf.data.TFRecordDataset(FILENAME, compression_type='')
for data in dataset:
    frame = open_dataset.Frame()
    frame.ParseFromString(bytearray(data.numpy()))
    plt.figure()
    # Draw the camera labels.
    count = 0
    for camera_image in frame.images:
        for camera_labels in frame.camera_labels:
            # Ignore camera labels that do not correspond to this camera.
            if camera_labels.name != camera_image.name:
                continue
            count += 1
            ax = plt.subplot(2, 3, count)
            # Iterate over the individual labels.
            for label in camera_labels.labels:
                # Draw the object bounding box.
                ax.add_patch(patches.Rectangle(
                    xy=(label.box.center_x - 0.5 * label.box.length,
                        label.box.center_y - 0.5 * label.box.width),
                    width=label.box.length,
                    height=label.box.width,
                    linewidth=1,
                    edgecolor='red',
                    facecolor='none'))
            # Show the camera image.
            plt.imshow(tf.image.decode_jpeg(camera_image.image))
            plt.title(camera_image.name))
            plt.grid(False)
            plt.axis('off')
    plt.show()
    plt.close()
The following shows some of the dataset.